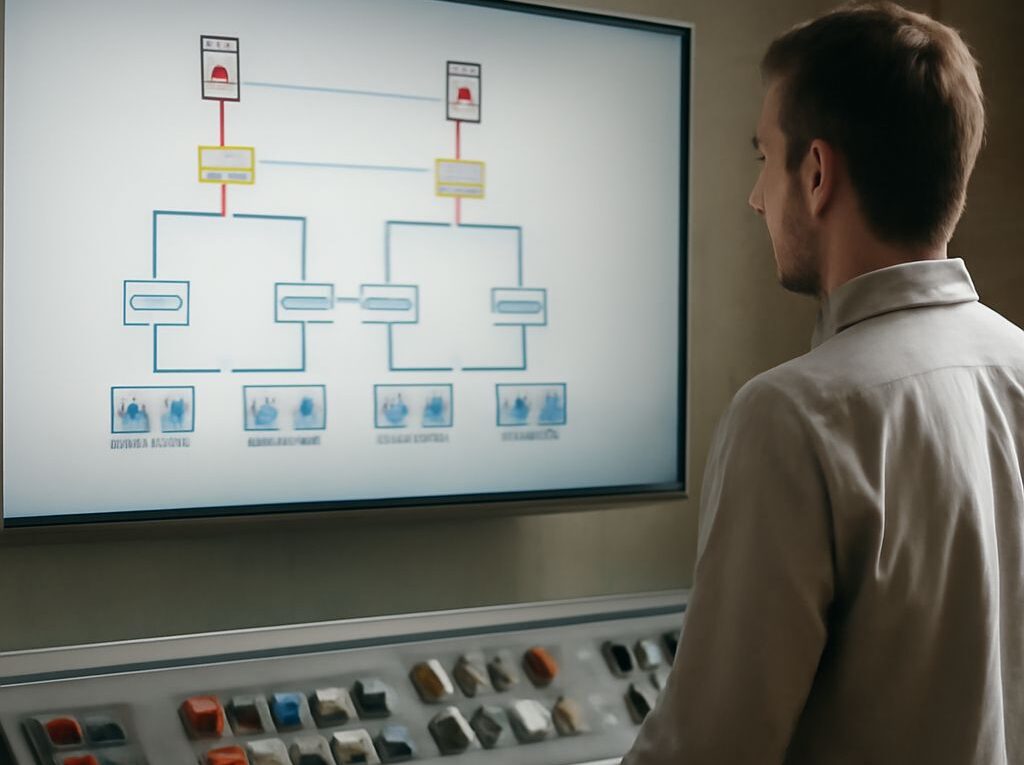
M2M Technology in SCADA and ICS: How HMI Systems Communicate
M2M technology in industrial environments connects sensors, meters, actuators, controllers, gateways, supervisory services, and operator interfaces so that machines can exchange measurements and commands with limited manual intervention. The communication path may be local and deterministic, remote and intermittent, or routed through several protocol and network layers.
These elements have different responsibilities. An industrial control system (ICS) includes the equipment and control functions; SCADA provides supervisory monitoring and data acquisition; an HMI presents information and accepts operator actions. In a SCADA ICS architecture, M2M communication carries telemetry toward supervisory applications and carries approved commands back toward controllers and field equipment.
What M2M technology means in industrial systems
M2M communication is the automated exchange of data between machines or machine-side software. A temperature transmitter can send a measured value to a programmable logic controller (PLC). The PLC can evaluate that value against a control rule and change a valve output. A remote terminal unit (RTU) can report the measurement to a SCADA server, while an HMI displays the resulting state to an operator.
The exchange does not require a person to relay every value or command. However, a person may still define control logic, approve a supervisory command, acknowledge an alarm, or change an operating setpoint. M2M describes the communication relationship, not the entire control strategy and not a replacement for operator oversight.
The main distinctions are:
- Local control: A PLC, RTU, drive, or embedded controller reads inputs and applies logic close to the process. It can often continue controlling equipment when an upper-level network is unavailable.
- Supervisory control: SCADA services collect data, calculate derived values, manage alarms, provide trends, and send authorized commands or setpoints to lower-level controllers.
- Visualization: An HMI renders tags, process states, trends, alarm lists, and control dialogs for an operator. It is an interface, not necessarily the device that performs the underlying control logic.
- Data recording: A historian stores time-series values and events for analysis, reporting, maintenance, and compliance processes. It is distinct from the real-time control loop.
A simple telemetry path illustrates the scope: a sensor measures pressure, a controller reads the signal, a gateway or RTU packages the value, a network transports it, a SCADA service interprets it as a tag, and an HMI displays pressure with its quality and timestamp. A command follows the reverse direction: an operator selects a new setpoint, supervisory software validates and sends it, the controller applies or rejects it, and the resulting state returns as feedback.
That feedback matters because sending a command is not the same as proving that equipment changed state. A successful network transfer may show only that a message reached its destination. Confirmation requires a response, a changed process value, an output state, or another device-specific indication.
How field devices, controllers, RTUs, and gateways work in SCADA and ICS
At the field level, endpoints produce measurements or perform physical actions. Endpoints include pressure and temperature transmitters, flowmeters, switches, motor drives, protective relays, valve positioners, energy meters, cameras, and actuators. They may use analog signals, digital inputs and outputs, serial links, Ethernet, wireless connections, or an embedded industrial protocol.
Some endpoints communicate directly with a controller. Others expose registers, objects, status bits, or variables that a controller or RTU reads. A field value usually has more than a number attached to it. Its useful data may include a tag or address, engineering unit, range, quality flag, alarm state, and timestamp.
Controllers execute the process logic. A PLC may scan inputs, run its program, update outputs, and repeat that cycle at a defined interval. A distributed control system controller may manage continuous process loops and coordinate many input and output modules. A machine controller may handle motion, sequencing, interlocks, or motor control.
The controller is normally the first decision-making layer. It can stop a pump when a local level switch indicates a dangerous condition, even if the SCADA server is offline. This separation keeps time-critical and protective actions near the equipment. A supervisory command can request a new operating state, but local permissives, interlocks, and safety logic may accept, limit, or reject that request.
RTUs are designed for remote monitoring and control, particularly where sites are geographically dispersed or power and bandwidth are limited. An RTU can scan local inputs, control outputs, maintain a clock, store events, and communicate with a central SCADA system over radio, cellular, satellite, leased lines, or IP networks.
Gateways connect unlike systems or networks. A gateway may translate Modbus RTU on a serial line into Modbus TCP on Ethernet, map proprietary device data into OPC UA, or publish selected values through MQTT. Some gateways only forward packets; others normalize addresses, apply data models, buffer records, or enforce communication rules. Protocol conversion can change how data is represented without changing the physical process value.
In an industrial control system, these roles are commonly arranged as a chain:
- An endpoint measures a process condition or receives an output instruction.
- A controller or RTU reads the endpoint and applies local logic, scaling, filtering, or interlocks.
- A gateway aggregates data or translates between a field protocol and an upstream protocol.
- A network transports messages to a SCADA server, edge service, or other supervisory application.
- The supervisory application assigns tags, evaluates quality, stores values, raises alarms, and presents data through an HMI.
The chain is not always linear. A controller may communicate directly with SCADA, a gateway may serve several serial devices, and an edge computer may run local visualization and buffering. The engineering decision depends on response time, site topology, protocol support, availability requirements, and the consequences of losing the upstream connection.
How SCADA moves telemetry and commands: addressing, protocols, polling, buffering, and transport
SCADA communication begins with an addressable data model. The system must identify the source device, the data location, and the meaning of the value. Depending on the protocol, an address may contain a station or unit identifier, register number, object instance, node identifier, topic, or symbolic tag. A SCADA tag such as Tank01.Level may map to a specific register in an RTU, an OPC UA node, or an MQTT topic supplied by a gateway.
Addressing prevents a measurement from being confused with a similar value from another device. It also supports command routing. A write request must identify the correct station, control point, output, or setpoint and use the data type expected by that endpoint. Incorrect scaling, byte order, range, or address mapping can produce a rejected command or an unsafe result even when the network connection works.
Protocols define how machines format, request, respond to, and validate messages. Common examples include Modbus RTU and Modbus TCP, DNP3, OPC UA, MQTT, and IEC 60870-5-104. These protocols differ in their data models, event handling, security features, timing behavior, and support for unsolicited reporting. The physical network and the application protocol are related but separate: Ethernet, fiber, serial cable, cellular, radio, and satellite provide transport, while the protocol defines the message exchange.
Polling means that a client repeatedly asks a device or server for current values. A SCADA driver may poll a group of registers every second, every five seconds, or according to the importance of the data. Faster polling can improve freshness but increases traffic and device workload. Slow or constrained links often use separate rates for critical status, routine measurements, and low-priority diagnostics.
Reporting by exception or unsolicited reporting allows a device or RTU to send a value when it changes, crosses a configured threshold, or meets an event condition. This can reduce bandwidth and improve event delivery, but it requires careful configuration. Deadbands prevent small fluctuations from generating excessive messages, while periodic integrity reports confirm that a quiet device is still communicating.
Telemetry often passes through several processing stages:
- The endpoint creates a raw value or state.
- The controller or RTU scales the value into engineering units and adds quality information.
- The gateway may convert the protocol, aggregate points, or compress the exchange.
- The SCADA driver validates the message, matches it to an address, and applies a tag definition.
- The supervisory service records the value with a timestamp and publishes it to alarms, trends, screens, and historian storage.
Timestamps show when a value was observed, received, or stored. The source device may timestamp an event at the field site; a gateway may timestamp a message during collection; and the SCADA server may timestamp its arrival. These times are not interchangeable. Accurate clocks and a documented timestamp policy are important when reconstructing the order of trips, alarms, commands, and state changes across remote sites.
Buffering protects data during temporary communication loss. An RTU may store events in local memory and forward them when the link returns. A gateway or edge service may use store-and-forward queues for selected measurements. The receiving SCADA system should distinguish live data from delayed data and retain the original event time where the protocol supports it. Buffer capacity, overwrite behavior, and resynchronization rules determine how much history survives an outage.
The command path reverses the direction of telemetry but adds validation steps. An operator selects a target and value in the HMI. SCADA checks permissions, range limits, mode, and sometimes an interlock condition. The driver addresses the target device and sends the command through the network and gateway. The controller evaluates the request, changes an output or setpoint if permitted, and returns an acknowledgement or updated state.
Command acknowledgement should be classified clearly. A communication acknowledgement can mean that a message was received. An application acknowledgement can mean that the device accepted the requested operation. A process confirmation shows that the equipment actually reached the requested state. For example, a pump-start command may be accepted by a controller while the motor remains stopped because a local permissive is false. The HMI should not display “running” until feedback confirms the motor state.
How HMI/SCADA handles visualization, alarms, history, acknowledgements, and communication failures
An HMI/SCADA workflow turns machine data into an operational view. The screen may show a current value, a quality indicator, a device mode, an alarm state, and the time associated with the data. A process graphic supports visualization, but it should not conceal whether a value is live, stale, substituted, or unavailable.
Visualization and control are separate functions. A screen can display a valve as open because it received an open feedback signal, while a command button requests that the valve open. The request is an action; the feedback is evidence of the resulting state. Useful interfaces distinguish commanded state, actual state, pending state, and failed or unknown state.
Alarm handling adds another layer. A SCADA service may generate an alarm when a value exceeds a limit, a digital state changes, a device reports a fault, or communication quality falls below an acceptable level. Alarm acknowledgement records that an operator has recognized the condition. It does not necessarily clear the underlying alarm and does not prove that the process returned to normal.
Historian data serves a different purpose from the live HMI value. The live screen supports immediate awareness and action. The historian preserves a time series for trends, event review, maintenance, and performance analysis. If a remote RTU forwards buffered data after an outage, the historian should use event timestamps where possible so the backfilled records appear in their original time order.
Communication failure should be visible as a state, not represented as a normal zero. SCADA and HMI systems commonly track quality or freshness indicators such as:
- Good: The latest value passed communication and validity checks.
- Stale: The value has not updated within its expected interval.
- Bad: The device, protocol exchange, or data validation reported an error.
- Substituted: A configured fallback or manually entered value is being displayed.
- Uncertain: The system received data but cannot fully verify its accuracy or timing.
During degraded communications, local control may continue while supervisory visibility deteriorates. A PLC can maintain a loop, an RTU can keep scanning inputs, and a gateway can buffer events even when the central HMI cannot receive updates. Conversely, a lost controller-to-device link may affect the process directly. The response depends on which segment failed: field bus, controller, gateway, WAN transport, SCADA server, or HMI client.
Operators therefore need separate indications for device failure, network failure, stale telemetry, command timeout, and loss of feedback. A command issued during an outage should remain pending or fail visibly rather than appear successful. When communications recover, queued telemetry should be identified as delayed, and queued commands should follow defined rules rather than execute unexpectedly without current validation.
The most reliable M2M design preserves this chain of meaning from endpoint to screen: what was measured, where it came from, when it occurred, how it was transported, whether it remains current, what command was requested, and which feedback confirms the resulting equipment state.